Math simulations
Small interactive visualizations for the linear-algebra ideas behind EE263. Open one and change the parameters to build intuition.

Linear maps
2×2 matrix as a transformation
Change the four entries and watch the grid stretch, rotate, shear, and collapse. The columns of A are the basis-vector images.
Calculus → linear algebra
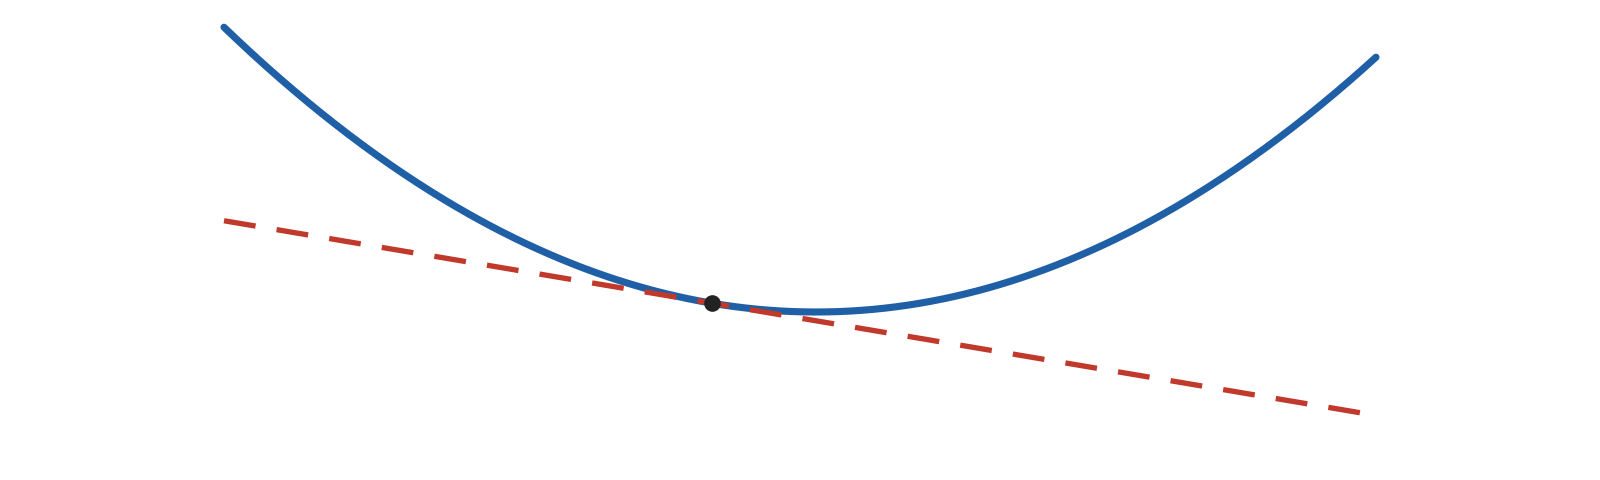
Linearization: tangent line & plane
See the best linear approximation of a nonlinear function in 1D and 2D, and where it stops being accurate.
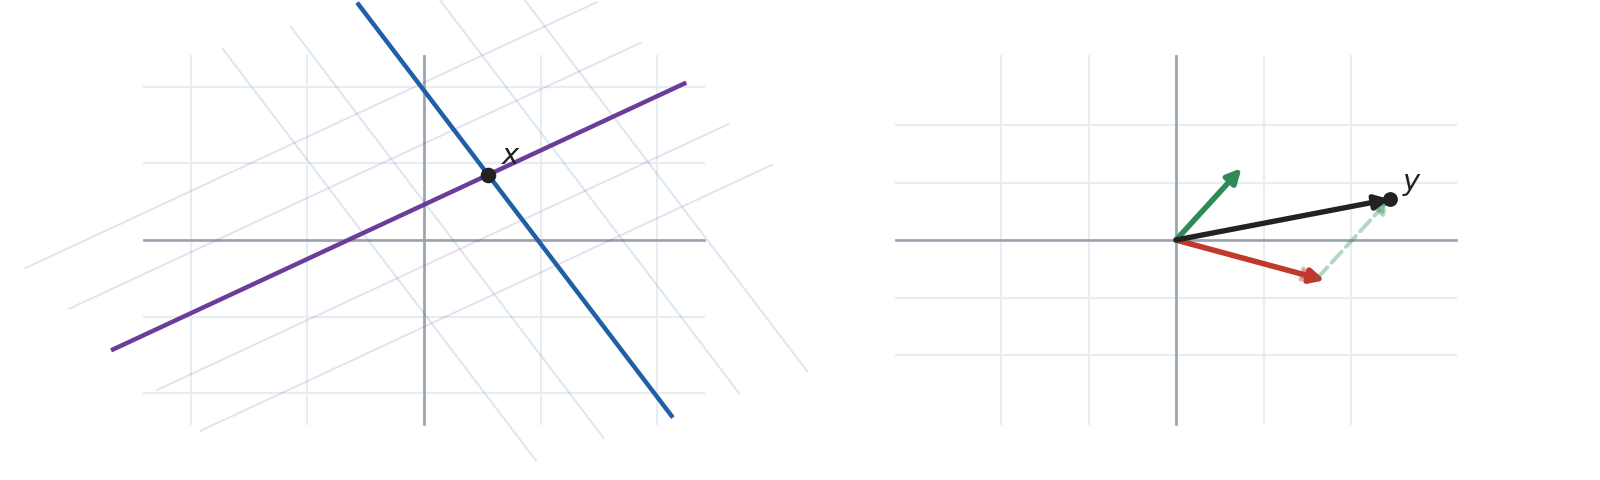
Interpreting y = Ax
Two views: columns & rows
The output as a mixture of columns, and the solution as the intersection of the row-lines. Make A singular to see both degeneracies at once.
Linear functions
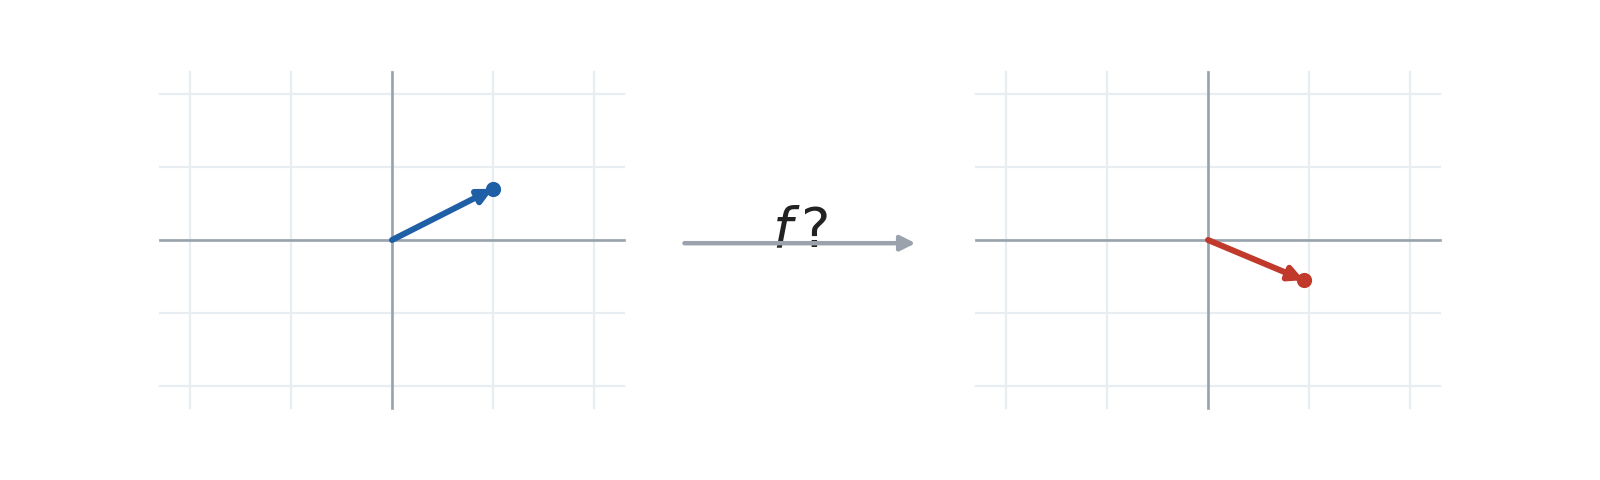
Linear or not?
Probe five hidden maps of the plane: feed inputs, read outputs, and decide which are linear. No formulas shown.